Data in Year 4
Year 4 are turning their home learning into practical and independent maths
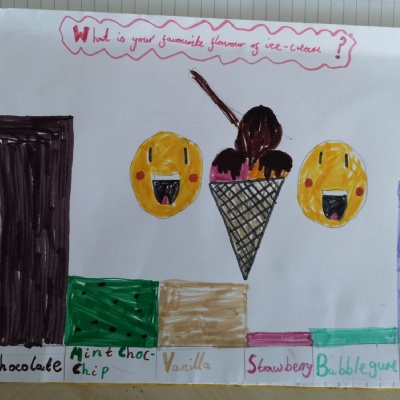
This week in Year 4, the children have been learning to create line graphs, tables, tally charts, bar graphs and pictograms. We have then been analysing and interpreting the data using problem solving skills. Check out this amazing bar chart made by Izzy for home learning, which she then converted into a pictogram in school.